The U.S. Hispanic Population and Hispanic Mental Health
1. The U.S. Hispanic Population
The U.S. Hispanic population is the nation’s second-largest racial/ethnic group, accounting for 20% of Americans. (U.S. Census 2024). It is also one of the fastest-growing groups in the U.S. Since 1970, when Hispanics made up 5% of the U.S. population, the Hispanic population has grown more than sevenfold. Between 2000 and 2024, Hispanics accounted for more than half of U.S. population growth. (Pew 2024)
While Hispanics are a diverse group from across Latin America, the majority of U.S. Hispanics are of Mexican origin, either born in Mexico or with ancestors’ roots in Mexico.
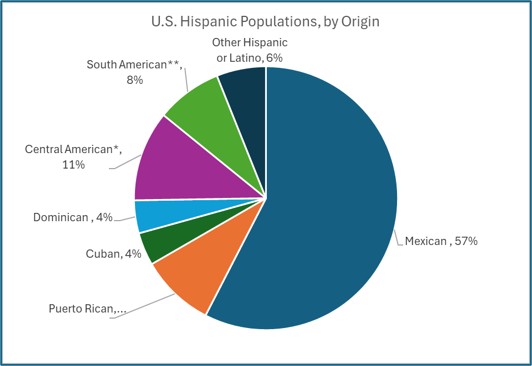
Table 1: U.S. Hispanic Populations, by Origin
| Country of Origin | % |
|---|---|
| Mexican | 57% |
| Puerto Rican | 9% |
| Cuban | 4% |
| Dominican | 4% |
| Central American* | 11% |
| South American** | 8% |
| Other Hispanic or Latino | 6% |
The percentage of U.S. Latinos born abroad peaked at 40% in 2000 and has since declined. In 2024, about one-third of U.S. Latinos living in the U.S. were born outside the country.
Language: An estimated 68% of Hispanics/Latinos age 5 years and older speak a language other than English at home, and 29% say they speak English “less than very well.” (U.S. Census, American Community Survey, 2024)
Income: In 2024, the median household income for Hispanic/Latino households was $72,574 compared to $81,604 for U.S. households. (U.S. Census, American Community Survey, 2024)
Sources and notes (Table 1 and Figure 1)
*Central American: Costa Rica, Guatemala, Nicaragua, Honduras, Panama, El Salvador, other Central American countries
**South American: Argentina, Bolivia, Chile, Colombia, Ecuador, Paraguay, Peru, Uruguay, Venezuela, other South American countries
- US Census, American Community Survey, 2024
- U.S. Census. 2021. 2020 Census Statistics Highlight Local Population Changes and Nation’s Racial and Ethnic Diversity
- Pew Research Center. 2025. Key Facts About U.S. Latinos.
- Pew Research Center. 2022. A brief statistical portrait of U.S. Hispanics.
2. Hispanic Mental Health
- 5% lower rate of serious psychological distress among Hispanic adults compared to the total population(1)
- 28% lower rate of receiving mental health treatment among Hispanic adults compared to the total population(2)
- Suicide was the second leading cause of death among Hispanics aged 25-34 in 2023(3)
Sources
- SAMHSA, 2025. Results from the 2024 National Survey on Drug Use and Health: Mental Health Detailed Tables. Table 6.88B.
- SAMHSA, 2025. Results from the 2024 National Survey on Drug Use and Health: Mental Health Detailed Tables. Table 6.21B.
- CDC. Web-Based Injury Statistics Query and Reporting System (WISQARS). Leading Causes of Death.
3. Mental Health Status - Adults
Table 2: Mental Health Status - Adults
| Hispanic | Total population | |
|---|---|---|
| Feelings all or most of the time, among persons ages 18 and over, 2018: | ||
| -- Sadness | 4% | 3% |
| -- Hopelessness | 3% | 2% |
| -- Worthlessness | 2% | 2% |
| -- Everything is an effort | 7% | 7% |
| Serious psychological distress in the past year among adults 18 years and over, percentage, 2024 | 13% | 14% |
| Major depressive episode in the past year among persons ages 18 and over, percentage, 2024 | 7% | 8% |
| Any mental illness in the past year among persons ages 18 and over, percentage, 2024 | 21% | 23% |
Sources (Table 2)
- CDC, 2021. Summary Health Statistics: National Health Interview Survey: 2018. Table A-7c. For the explanation of response categories see footnote 1 to Table A-7c.
- Substance Abuse and Mental Health Services Administration (SAMHSA), 2025. Results from the 2024 National Survey on Drug Use and Health: Mental Health Detailed Tables. Table 6.88B. For the definition of “serious psychological distress,” see Appendix A
- SAMHSA, 2025. Results from the 2024 National Survey on Drug Use and Health: Mental Health Detailed Tables.
- Table 6.41B. For the definition of “major depressive episode,” see Appendix A.
- Table 6.7B. For the definition of “any mental illness,” see Appendix A.
Dementia/Alzheimer’s Disease
- Hispanics are 1.5 times more likely than Whites to have dementia.
- More than 8 out of 10 Hispanics (85%) say it is important for Alzheimer’s and dementia care providers to understand their ethnic or racial background and experiences.
- One-third of Hispanic Americans (33%) report that they have experienced discrimination when seeking health care.
Source: Alzheimer’s Association. Hispanic Americans and Alzheimer's | Alzheimer's Association. More in Race, Ethnicity and Alzheimer's in America, 2021.
Suicide
Table 3: Suicide Rates by Age (2019, Per 100,000 population)
| Hispanic females | Total female population | Hispanic males | Total male population | |
|---|---|---|---|---|
| 15–24 years | 4.4 | 5.5 | 16.6 | 22.0 |
| 25–44 years | 4.0 | 7.4 | 16.1 | 28.0 |
| 45–64 years | 4.2 | 9.6 | 12.9 | 29.9 |
| 65 years and over | 1.0 | 5.2 | 12.3 | 31.7 |
| All ages, age-adjusted | 3.0 | 6.0 | 11.6 | 22.4 |
Source (Table 3): CDC, 2023. Health, United States, 2020–2021. Table SuicMort.
Table 4: Students in grades 9–12 who seriously considered attempting suicide/attempted suicide in the past 12 months (percentage, 2023)
| Seriously Considered Attempting Suicide: Hispanic | Seriously Considered Attempting Suicide: Total Population | Attempted Suicide: Hispanic | Attempted Suicide: Total Population | |
|---|---|---|---|---|
| Male | 12.1 | 14.1 | 6.6 | 6.4 |
| Female | 24.3 | 27.1 | 14.8 | 12.6 |
| Total population | 18.2 | 20.4 | 10.8 | 9.5 |


Sources, Table 4)
- CDC, 2024. High School Youth Risk Behavior Survey Data. High School Students Who Seriously Considered Attempting Suicide, 2023.
- CDC, 2024. High School Youth Risk Behavior Survey Data. High School Students Who Actually Attempted Suicide, 2023
4. Access to Healthcare
Table 5: Mental Health Treatment Among Adults (Percentage, 2024)
| Hispanic | Total Population | |
|---|---|---|
| Adults who received mental health treatment in the past year(1) | 16% | 23% |
| Adults who received mental health treatment with prescription medication(1) | 10% | 17% |
| Adults with depression who received treatment for depression(1) | 54% | 64% |
| Mental health counseling in the past year(2) | 11% | 14% |
| Taking prescription medication for depression(2) | 6% | 12% |

Sources (Table 5)
- SAMHSA, 2025. Results from the 2024 National Survey on Drug Use and Health: Mental Health Detailed Tables. Table 6.21B. Table 6.25B. Table 6.43B.
- Interactive Summary Health Statistics for Adults: National Health Interview Survey, 2019-2024
Table 6: Percent of Population without Health Insurance Coverage (2024)
| Hispanic | Total population | |
|---|---|---|
| Adults | 25% | 12% |
| Children under 18 | 8% | 5% |
Source: Interactive Summary Health Statistics for Children: National Health Interview Survey, 2019-2024
Rates of mental illness may be underdiagnosed among Hispanics compared to White people for several reasons, including a lack of culturally sensitive screening tools, financial barriers and other structural barriers, stigma, and discrimination. (Kaiser).